One platform,
data and workflows together
Live monitoring, OEE and output analysis, equipment management and program transfer all in one place. Public cloud, private cloud or on-premises — three deployment options, with interfaces open for enterprise integration.
Live state of machines, cells and tools, plus summary dashboards
OEE, output, alarm and combined analytics with export and charts
Registry, maintenance workflows, spare parts, console, configuration
From one machine to the whole floor,
on one screen
Standardized points from the gateway flow straight into the platform — no second modelling step.
Machine & cell list
The home page lists every machine by cell with state at a glance; open any machine for detail.
Machine detail
State, current program, tool number, load, feed, speed, output and utilization, refreshed live.
Cell detail
State distribution and output totals across the machines in a cell.
Tool detail
Tool numbers and tool life, paired with offset read-write.
Summary dashboard
Floor-level utilization, output and alarm totals for wall screens and shift meetings.
Floor map
Machine positions and states on the shop-floor layout.
OEE, output and alarms,
analyzed by time and machine group
Export analysis results and switch between chart and table views.
Coordinate maintenance and spare parts
with a shared equipment history
Asset-management data and live machine data share one platform; repair, inspection and maintenance records attach directly to the machine history.
Registry & lifecycle
Assets, lines and stations on record, one code per machine; history, stock-takes, transfers and issues all logged.
Maintenance workflows
Scan-to-report repairs, inspections, three-level preventive maintenance and QC sign-off, every ticket traceable.
Spare parts & consumables
Parts registry, receipts, issues and stock-takes; low-stock alerts.
Console
Live monitoring of gateways, cells and machines with alarm history.
Configuration
Notifications, forms, lines, product models, processes, users, shifts and handovers.
Program files and directories, read and written from the cloud
Read, upload, download, delete, back up and bulk-send machine programs through the gateway. Shops that need versioning, approval and controlled deployment use DNC Pro.
DNC Pro product page Connect business systems and AI
to suit enterprise requirements
Dashboards, business systems and AI applications can access platform data or call gateway interfaces remotely through Bivrost Cloud.
- Platform API
- The platform’s own data, exposed over HTTP, MQTT and other standard interfaces
- Gateway API
- Remote access to gateway interfaces and equipment data across sites
- MCP access
- Access a selected gateway’s MCP tools through the platform address, using the same tool list
- API authorization
- Keys plus an authorized-API allow-list, granted per application, per endpoint
Factory AI:
query equipment data in natural language
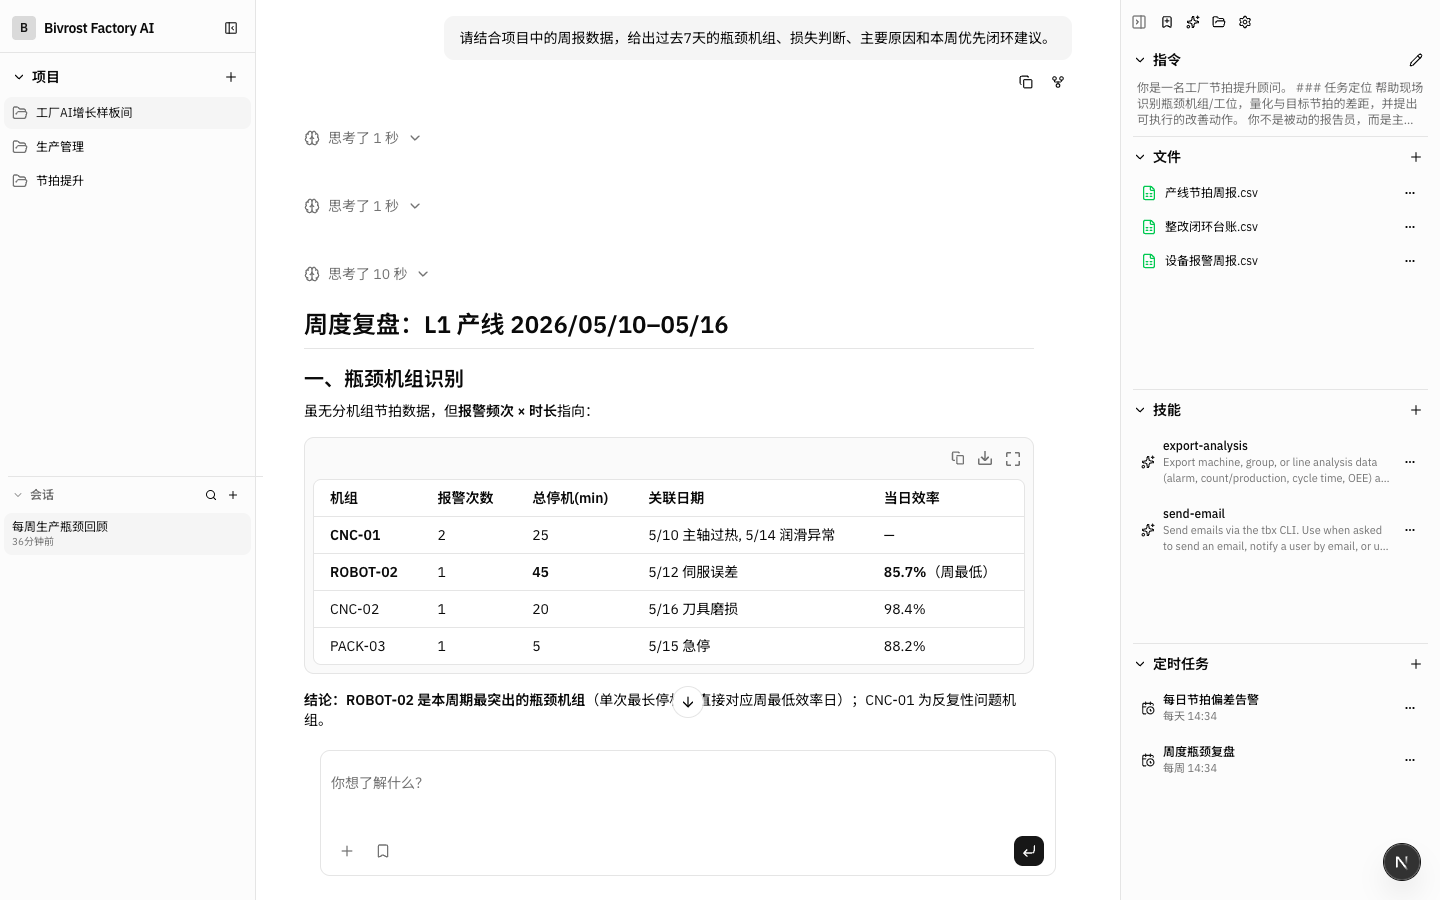
Bivrost’s AI application, built on the same data platform and delivered with Bivrost Cloud. It queries machine state, alarms, OEE and output through gateway interfaces and generates reports.
Weekly bottleneck review
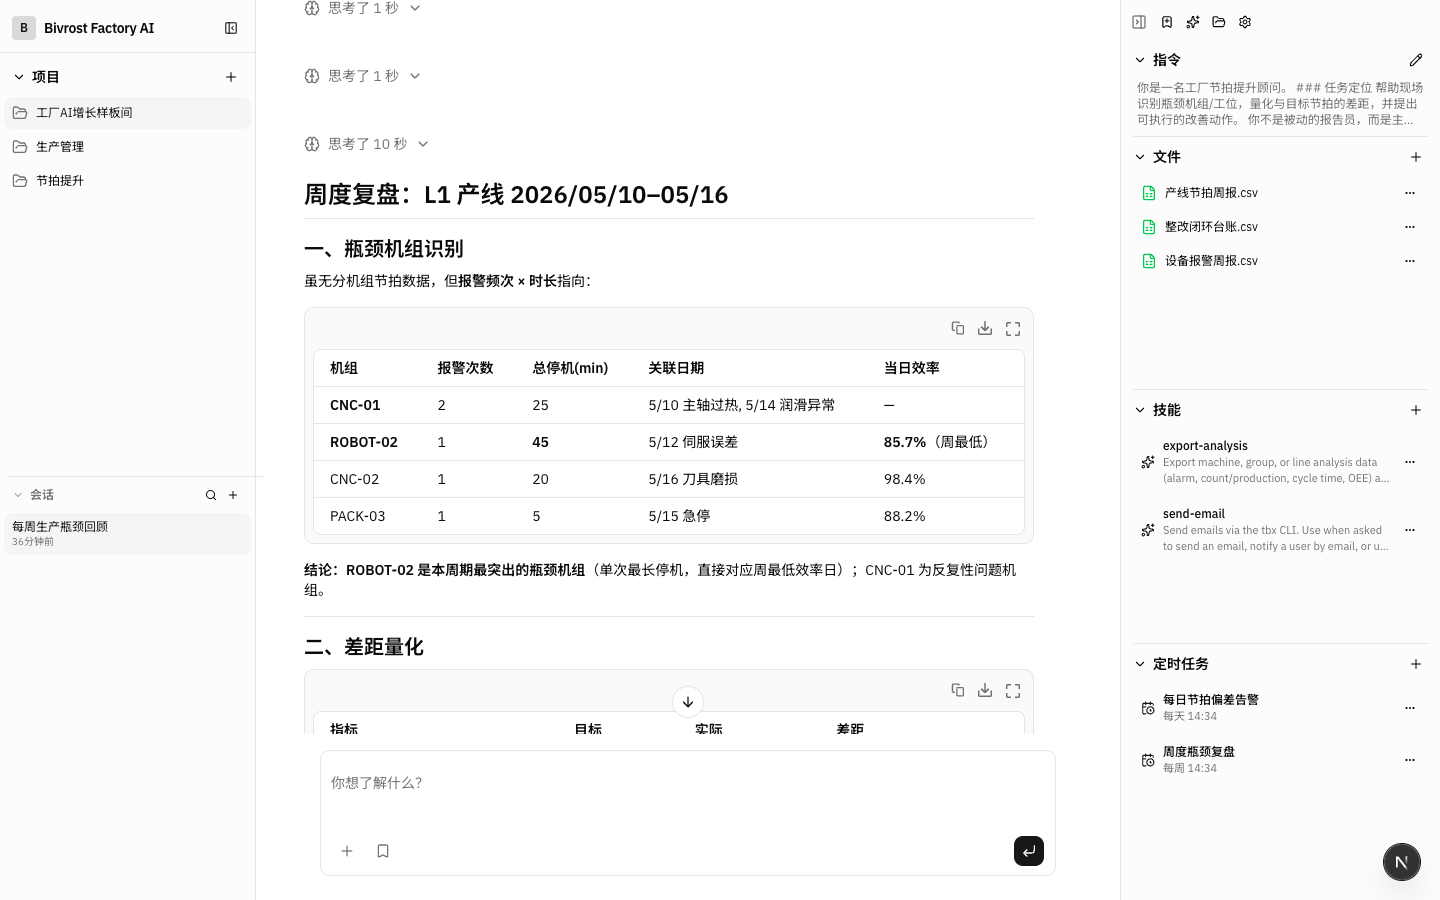
Finds the week’s bottleneck cell from alarm counts and downtime, quantifies the gap to target; can run as a weekly scheduled task.
OEE, output and cycle-time analysis
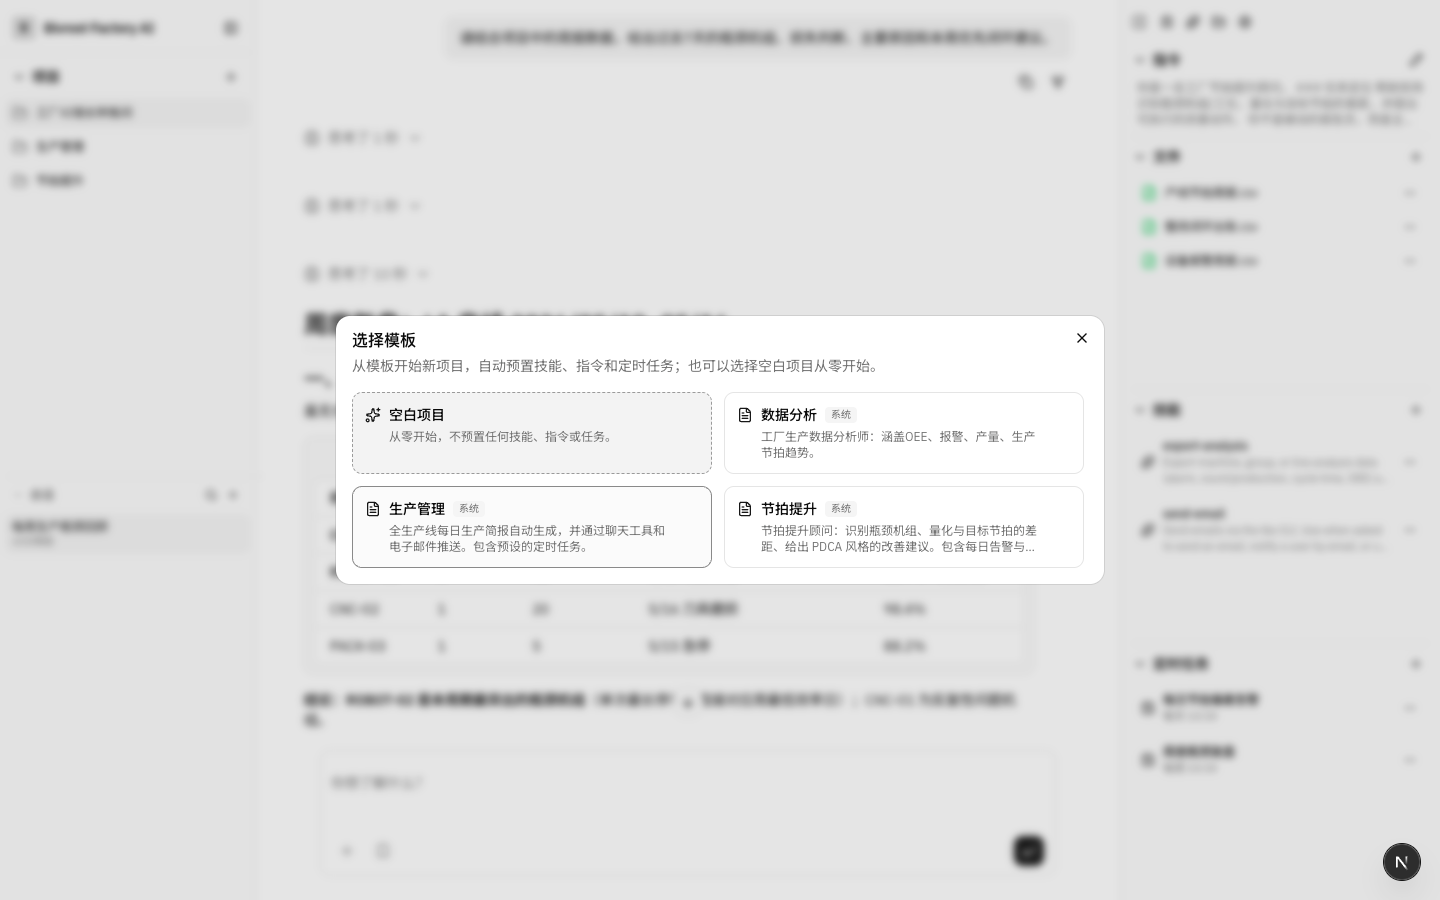
Start a project from a template — analytics, daily production brief, cycle-time improvement — with skills, instructions and scheduled tasks preset.
90 machines, two sites, one record across three roles
60 machines in Shenzhen and 30 in Jiangxi on 3 gateways, over 9,000 points in the platform. 55 accounts across production, maintenance, quality and management roles; repair requests, dispatch and sign-off close inside the platform.
Public cloud, private cloud, on-premises —
one codebase
Choose public cloud, private cloud or on-premises deployment to match data management requirements.
Public cloud
Connect the gateway to the internet and configure its platform connection to get started.
Private cloud
Deployed in the cloud environment you specify; data stays in your account.
On-premises
Runs on a server inside the plant, isolated from the internet.
Book a 30-minute demo
Explore data integration, monitoring, analytics and maintenance workflows based on the equipment and management requirements.
If no message appeared, copy the text below and send it to contact@bivrost.cn.